

MD&A · 2025
In this section4 topics
Overview of Operations
Overview of Operations
Revenue from sales and services THB 1,405.8 million Decrease 7.2% YoY | Profit for the period THB 277.3 million Increase 597.8% YoY | Profit sharing from associates THB 221.3 million Increase 111.0% YoY |
financial position for the year-ended December 31, 2025. The Company generated revenue of THB 1,405.8 million, a decrease of THB 109.4 million or 7.2% compared to the same period last year. The decrease in revenue was mainly due to lower revenue from special projects in the printing business segment and the packaging and labeling segment, while the platform technology business segment continued to grow. However, the Company maintained a gross margin of 34.7%, a slight decrease from 35.4% in the same period last year. The decrease was mainly due to drop in PassBook sales, as the PassBook segment has a relatively high gross margin. Nevertheless, the Company continues to manage production costs efficiently and focuses on expanding high-growth business segments (Growth Business), such as platform technology, which is a segment with high gross margins. The Company also recognized a share of profit from investments in associates of THB 221.3 million, an increase of THB 116.4 million or 111% to the same period last year, and the loss from investment in PTECH decreased by THB 238.8 million. As a result, the Company recorded profit for the period of THB 277.3 million, an increase of THB 333 million or 597.8% to the same period last year.
The Company reported a net profit from operations of THB 162.0 million, a decrease of THB 30.5 million or 15.8% from the same period last year. This was due to a decrease in gross margin from sales and service revenue as mentioned above.
As of December 31, 2025, the Company's total assets amounted to THB 4,384.4 million, a decrease of THB 60.7 million or 1.4% from December 31, 2024, mainly due to the recognition of net profit (loss) during the period. However, the financial position of the Company remains strong, with a debt-to-equity ratio of 0.27x.
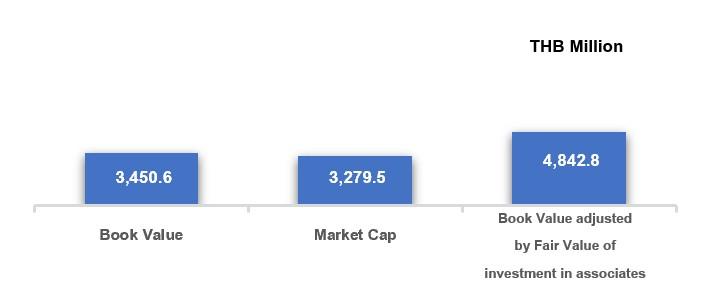
As of December 31, 2025, the net asset value of the Company (NAV) based on the consolidated financial statements compared to the Company's market capitalization and the book value adjusted by the fair value of the investment in associates net with deferred tax liabilities was shown as follows;
Overview Business Strategy - Tech Ecosystem Builder
The Company has continuously focused on adapting its businesses to keep up with digital disruption by developing the innovation of information technology and has internally restructured its group of companies to create a synergy both in terms of market and product development and in terms of reducing production capital to increase its overall competitiveness to maintain its existing business base alongside finding new business partners. Currently, the Company has invested in 4 major businesses as below: -
Overview Business Strategy - Tech Ecosystem Builder (Cont’d)
Image & Security Fulfillment
Platform Solution
IT & Digital Ecosystem
Investment
Operating Results & Financial Condition
Operating Results & Profitability
Revenue and gross profit for the fourth quarter of 2025.
The Company generated revenue from sales and services of THB 346.6 million, a decrease of THB 26.1 million or 7.0% compared to the same period last year (YoY). Compared to Q3 2025 (QoQ), The Company’s revenue from sales and services decreased by THB 3.4 million or 1.0%, mainly due to a decrease in the digital print management business.
The Company’s gross profit margin was 32.2%, a decrease from 33.5% in the same period last year (YoY). Although the gross profit margin decreased compared to both the same period last year and the previous quarter, the Company continued to manage production costs efficiently (GP remained above 32%) and focused on expanding high-growth business segments such as platform technology.
Selling and administrative expense
The Company’s selling and administrative expenses were THB 73.5 million, an increase of THB 5.7 million or 8.4% compared to the same period last year (YoY), When compared to Q3 2025 (QoQ), The Company’s selling and administrative expenses decreased by THB 0.6 million or 0.8%. This decline was in line with the decrease in revenue from sales and services, particularly from the digital customer data printing business segment.
Finance cost and Income Tax
The Company incurred financial costs of THB 3.9 million, a decrease of THB 3.3 million or 45.8% compared to the same period last year (YoY), mainly due to a reduction in long-term loans from financial institutions. Compared to Q3 2025 (QoQ), The Company’s finance costs decreased by THB 0.7 million due to the reduction in long-term loans from financial institutions.
The Company had income tax expenses of THB 5.7 million, a decrease of THB 2.0 million or 26.0% compared to the same period last year (YoY), primarily due to a decrease in operating profits. Compared to Q3 2025 (QoQ), the Company’s income tax expenses also decreased, which was in line with the decrease in operating profits.
Profit sharing from investment in associates and dividend received from investment
The Company recognized a share of profit from investments in associates of THB 74.4 million, an increase of THB 82.7 million or 996.4% compared to the same period last year (YoY), and a decrease of THB 1.9 million or 2.5% compared to Q3/2025 (QoQ). This was primarily driven by the share of profit from SYNEX in Q4/2025.
Gain (loss) from extraordinary items
Q4’2025: No extraordinary items
Q3’2025: The Company recognized a loss resulting from the loss of significant influence in associate of THB 20.4 million and recognized a Loss on fair value adjustment arising from reclassification to investment of THB 14.6 million. As a result, the total loss from extraordinary items amounted to THB 35.1 million.
Liquidity & Capital Adequacy
The Company has cash and cash equivalents totaling THB 139.7 million, which decreased by THB 35.0 million from the beginning of the period. The cash flow items are as follows:
Net cash flow from operating activities amounted to THB 309.6 million, primarily due to net cash from operations, with income tax payments during the year of THB 31.4 million.
Net cash flow used in investing activities was THB 116.1 million, mainly due to dividend receipts from SYNEX and other investments, namely MSC and AIT, totaling THB 189.7 million, and Net cash used in purchasing fixed assets was THB 56.8 million, net cash used in acquiring investments was THB 25.3 million.
Net cash flow used in financing activities was THB 460.7 million, primarily due to net cash receipts from borrowing and repayments during the period of THB 15 million, dividend payments of THB 212.9 million, interest payments of THB 19.1 million, repayments of long-term loans of THB 131.2 million and Stock Repurchase of THB 46.4 million
Asset Management Capability
Assets
As of December 31, 2025, the Company has total assets of THB 4,384 million, a decrease of THB 61 million or 1.4% from December 31, 2024. The significant changes are as follows:
Investments in associates decreased by THB 154 million, mainly due to the company recognizing an impairment loss in PTECH.
Fixed assets decreased by THB 31 million due to regular depreciation.
ther financial assets increased by THB 166 million, primarily due to the purchase of investments and the reclassification of certain investments during the period.
Liabilities
As of December 31, 2025, the Company has total liabilities of THB 934 million, a decrease of THB 124 million or 11.7% from December 31, 2024. The significant changes in liabilities are as follows:
ther liabilities increased by THB 30 million, mainly due to an increase in trade payables of THB 7 million from the gradual ordering of raw materials for production during 2025, and an increase in other current payables of THB 19 million.
Interest- bearing liabilities decreased by THB 155 million, mainly due to the repayment of long-term loans from financial institutions upon maturity.
Shareholder’s Equity
As of December 31, 2025, the Company has total shareholders' equity of THB 3,451 million, an increase of THB 63 million or 1.9% from December 31, 2024. The main reasons were net profit for the year-ended of THB 295 million and THB 15 million fair value adjustment of a startup investment, during the year 2025, the Company paid an annual dividend of THB 213 million in cash.
During 2025, the Company repurchased a total of 7.79 million ordinary shares or 1.53% of its total paid-up shares, under the Treasury Stock program for financial management purposes. The total repurchase value amounted to THB 46.36 million, for which the Company concurrently appropriated an equivalent amount of retained earnings as a treasury stock reserve.
Debt to Equity Ratio
The debt-to-equity ratio and the interest-bearing debt-to-equity ratio as of December 31, 2025, were 0.27x and 0.15x, respectively, showing a slight decrease from December 31, 2024.
Fair value
The following table presents the carrying amounts and fair values of assets measured at fair value or disclosed at fair value according to the consolidated financial statements and the notes to the financial statements of the Company as of December 31, 2025.
Unit: THB million
Carrying Amount | Fair Value | |
Assets measured at fair value | ||
Investment in equity securities and derivative | 907 | 907 |
Assets disclosed fair value | ||
Investment in associates | 1,855* | 3,247 |
* The carrying amount of investments in associates was measured using the equity method in accordance with applicable accounting
Other Analysis
| Title | Description | ||||||||||||||||||||||||||||||||||||||||||||||||||||||||||||||||||||||||||||||||||||||||||||||||||||||||||||||||||||||||||||||||||||||||||||||||||||||||||||||||||||||||||||||||||||||||||||||||||||||||||||||||||||||||||||||||||||||||||||||||||||||||||||||||||||||||||||||||||||||||||||||||||||||||||||||||||||||||||||||||||||||||||||||||
|---|---|---|---|---|---|---|---|---|---|---|---|---|---|---|---|---|---|---|---|---|---|---|---|---|---|---|---|---|---|---|---|---|---|---|---|---|---|---|---|---|---|---|---|---|---|---|---|---|---|---|---|---|---|---|---|---|---|---|---|---|---|---|---|---|---|---|---|---|---|---|---|---|---|---|---|---|---|---|---|---|---|---|---|---|---|---|---|---|---|---|---|---|---|---|---|---|---|---|---|---|---|---|---|---|---|---|---|---|---|---|---|---|---|---|---|---|---|---|---|---|---|---|---|---|---|---|---|---|---|---|---|---|---|---|---|---|---|---|---|---|---|---|---|---|---|---|---|---|---|---|---|---|---|---|---|---|---|---|---|---|---|---|---|---|---|---|---|---|---|---|---|---|---|---|---|---|---|---|---|---|---|---|---|---|---|---|---|---|---|---|---|---|---|---|---|---|---|---|---|---|---|---|---|---|---|---|---|---|---|---|---|---|---|---|---|---|---|---|---|---|---|---|---|---|---|---|---|---|---|---|---|---|---|---|---|---|---|---|---|---|---|---|---|---|---|---|---|---|---|---|---|---|---|---|---|---|---|---|---|---|---|---|---|---|---|---|---|---|---|---|---|---|---|---|---|---|---|---|---|---|---|---|---|---|---|---|---|---|---|---|---|---|---|---|---|---|---|---|---|---|---|---|---|---|---|---|---|---|---|---|---|---|---|---|---|---|---|---|---|---|---|---|---|---|---|---|---|---|---|---|---|---|---|---|---|---|---|
| Financial Information | Financial Performance for the 4th quarter ended December 31, 2025
* Profit (loss) from extraordinary items comprise of:
| ||||||||||||||||||||||||||||||||||||||||||||||||||||||||||||||||||||||||||||||||||||||||||||||||||||||||||||||||||||||||||||||||||||||||||||||||||||||||||||||||||||||||||||||||||||||||||||||||||||||||||||||||||||||||||||||||||||||||||||||||||||||||||||||||||||||||||||||||||||||||||||||||||||||||||||||||||||||||||||||||||||||||||||||||
Debt Securities with Financial Ratio Requirements
Debt Securities with Financial Ratio Requirements Issued?
No
Factors That May Affect Financial Condition
Factors or Incidents That May Materially Affect Financial Condition
The factors or events that may significantly impact the financial position or operations in the future, such as economic trends, changes in market or industry conditions, and internal factors such as strategic policies, corporate management, and changes in business agreements that may affect operations. Additionally, other factors such as environmental trends and impacts, social factors, including respect for human rights, and good corporate governance.